The Useful Life of Housing Units
A Study in Honor of the Millennium
U.S. Department of Housing and Urban Development
Division of Housing and Demographic Analysis, 1998
Summary
Housing units are extremely long term capital stock, usually lasting for several generations, and affecting communities and neighborhoods far into the future. The average life expectancy for all housing units is at least 93 years. The average ranges from about 35 years for mobile homes to over 130 years for buildings with 20 units or more. Some stay as housing, others last this long by being converted into offices or stores, and sometimes back again into homes. Past changes, social, economic, or technological, have not made most housing units obsolete, but have been accommodated successfully by the existing housing stock. Construction codes have been improving; buildings being built today may last even longer.
Findings
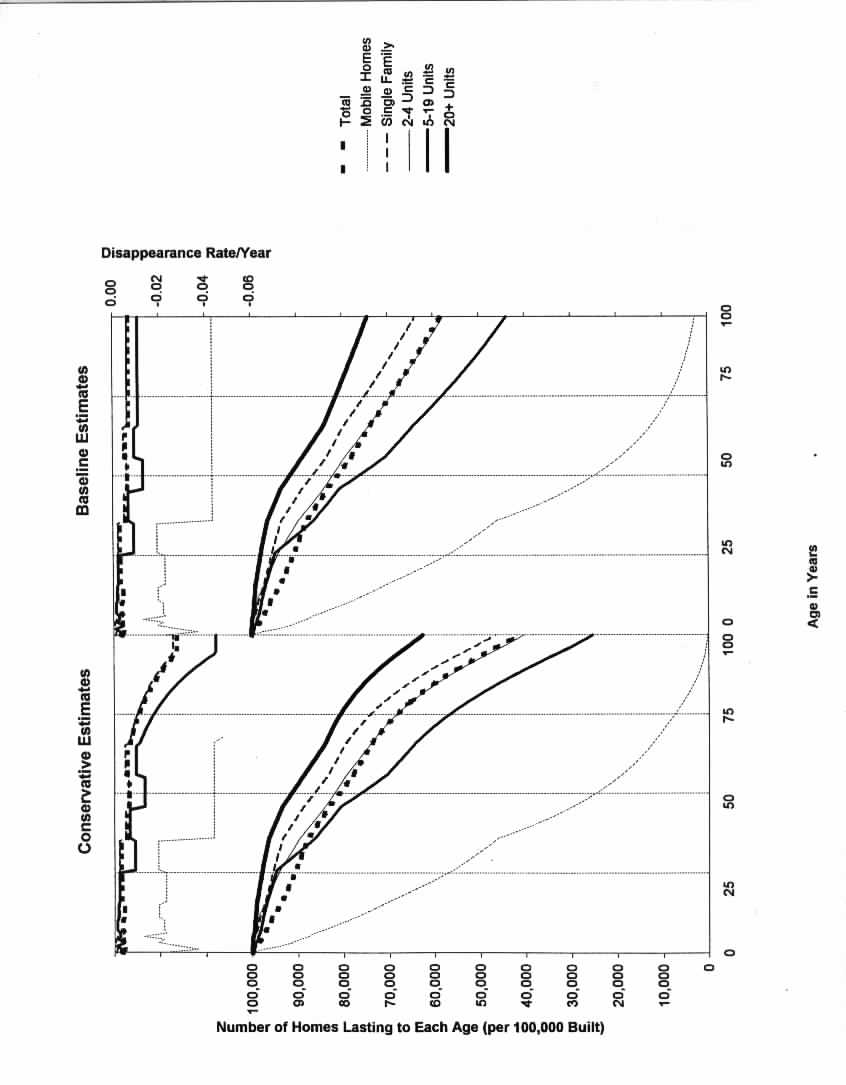
The life expectancy for homes varies from 34 years for mobile homes to 132 years for buildings with 20 units or more. These are conservative estimates which assume that very old homes, on which we have limited data, disappear at rates higher than the American Housing Survey actually shows. The baseline estimates (consistent with the data, as discussed in the Methodology section) range from 35 years for mobile homes up to 264 years for buildings with 20 units or more. Single family homes last 101 or 180 years. Buildings with two to four units last 93 or 158 years. Buildings with five to 19 units last 79 or 114 years.
|
Table 1. Building Lives, in Years, by Type of Structure |
||||
|
Conservative Estimates |
Baseline Estimates |
|||
|
|
Median |
Mean |
Median |
Mean |
|
All Housing Units |
93 |
93 |
122 |
162 |
|
Mobile Homes |
31 |
34 |
31 |
35 |
|
Single Family |
97 |
101 |
138 |
180 |
|
2-4 Unit Buildings |
92 |
93 |
119 |
158 |
|
5-19 Unit Buildings |
81 |
79 |
88 |
114 |
|
20+ Unit Buildings |
115 |
132 |
211 |
264 |
These life expectancies are averages (means), and are greatly affected by the few homes that last for a very long time. Medians are less sensitive to these few homes. The overall median life is 93 years (conservative) or 122 years (baseline). The medians for single family homes and for buildings with 20 units or more are longer (97 to 211 years). The overall median is brought down by the shorter useful lives of mobile homes (31 years), and buildings with 2-4 or 5-19 units (81-119 years).
The graph shows the survival of each type of home. The right side has the baseline estimates. As the top of the figure shows, the baseline estimates assume that homes over 66 years old have the rates of disappearance reported in the survey, no matter how old they are. The left side of the graph is more conservative. It assumes the rate of disappearance, for homes older than 66 years, rises with age until it quadruples. The overall rate is then 2 3/4 % per year for homes older than 100 years (which historical preservationists are unlikely to allow). The rates, after 66 years, are higher in the conservative estimates than reported in the survey, and the survival of all types of units is lower than in the baseline estimates.
As the figure shows, mobile homes virtually disappear in 75 years (probably most of the ones remaining then would have permanent structures built onto them). Mobile homes are a fairly new technology; the American Housing Survey does not collect very detailed age data on them; newer ones are built to higher standards than older ones; and the actual survival figures into the distant future are hard to guess.
The figure also shows that large buildings appear to last longest. They certainly represent major investments for their owners, usually have professional management, and are built of durable materials in highly accessible areas. It is reasonable for them to last long. They do face risks from societal change, for example rising real incomes and public desires for outdoor space, but they also face opportunities in the rising numbers of elderly who may dislike the maintenance that occupants need to do on smaller buildings. The data are also weak for these buildings, since there are not many, and occupants often do not know when they were built.
Most units are single family and they survive nearly as well as buildings with 20 units or more. They are scattered in virtually all types of neighborhoods, have survived well from the past, and are relatively easy to retrofit with each new technology or fashion that comes along. The figures for single family homes are based on the largest amount of data, and are probably the most reliable here.
Past Experience and Caveats
There is an estimate of housing production in the 1920s (7.0 million units started construction), in "Residential Real Estate" by David L. Wickens, National Bureau of Economic Research, 1941, as quoted in Housing Construction Statistics 1889 to 1964 by the Census Bureau, 1966, and in Bureau of Labor Statistics Bulletins 1168 and 1260 (1954 and 1959). This Census report considers Wickens' figures incomplete, but does not estimate by how much. The current housing units reported to be that age are 79% of this estimate of the original production, about 70 years later. This compares favorably to the estimates in our survivorship table (72% remaining after 70 years), even though the survivorship table summarizes current disappearance rates, not the rates over the past 70 years.
|
Historical Data on Housing Stock Numbers in millions |
||||||||
|
Year |
Housing Units that Existed in Year Shown at Left |
Units Started in Preceding Decade |
||||||
|
Total Then |
Occupied Then |
Remaining Housing Units in 1995 |
Total Then |
Remaining in 1995 |
||||
|
|
Number |
Percent |
Number |
Percent |
Number |
Number |
Percent |
Average Age in 1995 |
|
1920 |
126.1 |
24.4 |
10.0 |
38% |
210.0 |
unknown |
||
|
1930 |
132.0 |
29.9 |
15.6 |
49% |
7.0 |
5.5 |
79% |
70 |
|
1940 |
37.3 |
34.9 |
22.1 |
59% |
2.7 |
6.6 |
244% |
60 |
|
1950 |
46.0 |
42.8 |
30.5 |
66% |
7.4 |
8.4 |
114% |
50 |
|
1960 |
58.3 |
53.0 |
44.1 |
76% |
15.1 |
13.6 |
90% |
40 |
|
1970 |
68.7 |
63.4 |
59.9 |
87% |
14.4 |
15.8 |
110% |
30 |
|
1980 |
88.9 |
80.3 |
83.6 |
94% |
17.9 |
23.7 |
132% |
21 |
|
1990 |
102.3 |
91.9 |
100.9 |
99% |
15.0 |
17.3 |
115% |
10 |
|
1995 |
109.5 |
97.7 |
109.9 |
100% |
37.5 |
38.6 |
115% |
3 |
|
1Total stock is estimated from occupied stock
and 1940 vacancy rate of 6.6% (1950 was 6.9%) Source: Census Bureau: |
||||||||
Unfortunately for this comparison, Table 2 shows either that people have very inaccurate ideas of when their homes were built, or that old homes are subdivided at high rates. From the 2.7 million homes that were started in the decade before 1940, people claim 6.6 million homes existed in 1995 of that age. Similarly of the 17.9 million homes started in the decade before 1980, people claim 23.7 million existed in 1995. When one adds the facts that some starts were not completed, that some homes of each vintage have certainly been converted to other uses and still exist uncounted here, and the fact that others have disappeared, it is hard to trust these comparisons enough to confirm or reject the life expectancy estimates. At least the data are consistent with the idea that homes last a long time. In general people think things happen more recently than they really did (though the research is based on short periods of time, not on decades), so current homes may be generally older than reported..
The life expectancy estimates use the data on year built from the 1985 survey to put each disappearing house into the right cohort, so they suffer from the doubtful accuracy of the surveys. The effect of errors in year built is probably to smooth the disappearance rates, by contaminating each rate with disappearances from other cohorts. Thus the disappearance rates of older cohorts may be more like our conservative estimates than the actual data in the baseline estimates. The effect of splits and merges is not significant, since we do not count those units as disappearing.
We can also compare the number of housing units of various ages now, to the total number existing in the past. This comparison shows that over a third of the homes existing in the 1920 Census still exist as housing units. (An unknown number of others have been converted to offices or stores, so their useful lives continue but are not measured here.) If we assume that the homes still existing from the 1920 Census were on average 25 years old then (current median age is 28, 1925 mean age was 27), they would now, 75 years later, be 100 years old. This is another illustrative comparison, to show that the life expectancies given above may be reasonable, but this comparison is stifi infected by problems of data reliability.
Implications
Housing units are extremely long term capital stock, lasting several generations. Depreciation rules and mortgage terms currently do not treat them as lasting this long, though there may be reasons based on building up repair reserves, and minimizing the risk to the lender from adverse neighborhood changes.
It is possible but unlikely that future technological, social or economic change could cut short some current buildings' useful lives. Past social and economic changes have included divorce, aging, some integration, immigration, migration to cities, suburbs, the North, then the West and South, tightening of housing codes, increases in real incomes, condominiums and cooperatives and mortgage insurance which permitted mass homeownership, rental subsidies, income taxes, etc.
Houses disappear not just if they wear out or have unacceptable design, but also from location effects. Urban renewal in the 1950s destroyed many homes, because the location was considered to require it. Ghost towns and depopulating areas, whether some farming areas or some parts of central cities, make homes no longer viable. Much of the slack is taken up by normal attrition, with virtually no new construction to~ replace the units lost by disasters, but units are also torn down when they stay vacant too long, and either they become hazards, or the land is needed for something else. The present housing stock has accommodated major changes in demand for different locations, and has a lot of flexibility to handle future changes.
Past major technological changes have also successfully been accommodated by existing structures, including: gas, electricity, central heat, indoor plumbing, automobiles, air conditioning, fire escapes and wheelchair ramps. The only exception seems to be elevators, which made tall walkup buildings unmarketable.
Houses framed with studs and nails (balloon construction) are a newer technology than bricks, stones, logs, or post and beam, so they might decay, but some have already lasted over a century, and Victorian homes can be maintained to current standards. One might believe that old homes were better built and current homes will start to show higher rates of disappearance when they reach a certain age, but older cohorts of homes originally included even worse shacks and slipshod construction. The best ones lasted, as the best ones of current cohorts will last. Building codes are much stronger than they used to be, in materials, in design (such as earthquake proofing, windows, plumbing, wiring), in location (such as flood plain rules, setbacks, zoning), so life expectancies are at least as likely to rise as to fall.
Future Research
This research could be extended in numerous directions. Simplest would be to calculate life expectancies of other categories, for example by region, by size of town, by density of construction, or by construction design.
The accuracy of the life table could be improved if the American Housing Survey questionnaire identified more age breaks in the distant past (such as 1900, 1850 and 1800), and tried to distinguish firm knowledge of building age from guesses.
Historical sources could be studied to compare the distribution of original construction strength now and a century ago.
The homes dropping out of the stock could be studied to understand the reasons (in order to lengthen the lives of better housing, and perhaps shorten the lives of worse housing). The survey already measures how many are lost to natural disasters; a useful and inexpensive addition might be to return to the sites and see how many are re-used for housing, commercial purposes, vacant land, etc.
Methodology
A survivorship table is traditionally used to estimate life expectancy for groups of people. The method is to hypothesize a starting population of 100,000, then assume a death rate in the first year equal to the current death rate among people less than a year old. This death rate leaves a certain number of the 100,000 people who reach year 1. They are then assumed to face another death rate, the current rate among people one to two years old. The calculation continues until no one is left. (Special data sources, like pension records, are used for the very old, where actual data are rare.) The average length of life in this hypothetical cohort of 100,000 is called the life expectancy. It is a way to summarize current death rates. Note that current death rates happen among people who were born over a wide range of past years. The survivorship table rearranges them into sequence, to happen one after another in the table.
We use this approach with the lives of houses. The American Housing Survey measures the rates of disappearance of houses: the number of houses of each age that are destroyed each year. We apply these disappearance rates to a hypothetical starting group of 100,000 homes. Very few homes disappear in their first year, though some do, since fires and other disasters can happen any time. For homes built in recent years we have the exact year they were built, so we have their exact age. For homes built before 1979 we have data for groups of years (before 1920, 1920s, 1930s, 1940s, 1950s, 1960s, 1970-74, 1975-78, then exact years). Therefore we can calculate the disappearance rate for these groups of homes.
We are calculating the useful lives of homes, but not necessarily how long they remain housing units. Many homes convert to offices or stores at some time in their lives. Some convert back again. The American Housing Survey monitors such buildings and reports when they finally disappear for good, by demolition, other destruction, or being moved away (primarily mobile homes). Since we do not follow the homes when they move, we are really measuring the useful lives of homes at their current locations. Many mobile homes are destroyed after they are moved off their first site, but some do enter the statistics again at a new location.
The number of homes disappearing each year varies with economic cycles: the cost of construction, demand for housing, etc. To smooth out these cycles we use the longest span we can, ten years where the same group of homes was surveyed, from 1985 to 1995. We note the date built (reported in the 1985 survey) and whether the unit was destroyed or moved away between then and the 1995 survey. This comparison gives us a 10-year disappearance rate for homes of each age, and we use the 10th root of this rate for each year in the survivorship table.
The oldest homes are grouped in the survey as 'built before 1920,' so they were 66 or more years old by the end of 1985. We have figures for the overall rate of disappearance of these homes and the rate is quite low. We do not know how the rate varies by age among these older homes. Certainly a cohort of homes never completely disappears: some buildings in Southwestern pueblos may be thousands of years old. Other historical structures remaining from colonial times are also valued and preserved, whether made from stone, brick, adobe, or logs.
For simplicity we assume either (A) the disappearance rate is constant for homes over 66 years old (our baseline approach), or (B) the rate rises 5% per year (for example from 0.20% to 0.21%) until it quadruples (our conservative approach). This limiting rate for the very oldest homes involves about one home disappearing per year out of every 36. Historical preservation laws are unlikely to allow that high a rate of disappearance, so actual life expectancy is likely to be higher than this conservative approach. Both sets of results are given in the Findings section.
As noted above, a survivorship table and life expectancy figures from it are simply summaries of present death rates, or disappearance rates. They are not literally predictions. A prediction for how long today's babies will live, or how long today's homes will last, ought to take into account changes which may make future survivorship better or worse than the present. In fact actual lives are likely to be longer than the current life expectancy, because of technological advances, assuming no massive change in past trends, such as war damage.